The Ten Panels of Adams' Map of History
Sebastian C. Adams' 1881 chart, also known as Adams' Map of History, reads from left to right in ten panels, from 4004 BC to the late 1870s. Each page below walks through one panel: the years it holds, the people, nations and events Adams records there, and what to look for when you zoom.
-
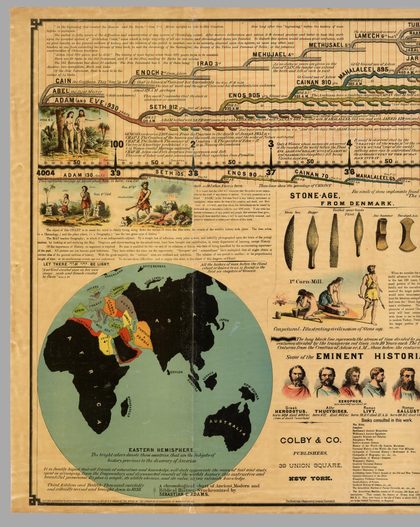 Panel 1
The Creation and the First Patriarchs
c. 4004–3500 BC
Panel 1
The Creation and the First Patriarchs
c. 4004–3500 BC
Panel 1 of Sebastian C.
-
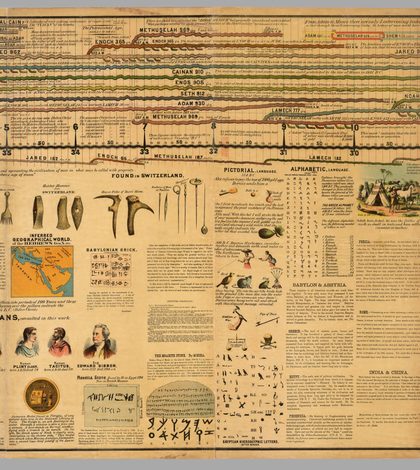 Panel 2
The Patriarchs Before the Flood
c. 3500–2900 BC
Panel 2
The Patriarchs Before the Flood
c. 3500–2900 BC
Panel 2 of Sebastian C.
-
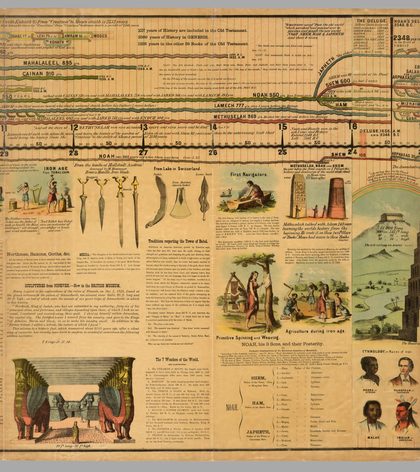 Panel 3
Noah and the Deluge
c. 2900–2300 BC
Panel 3
Noah and the Deluge
c. 2900–2300 BC
Panel 3 of Sebastian C.
-
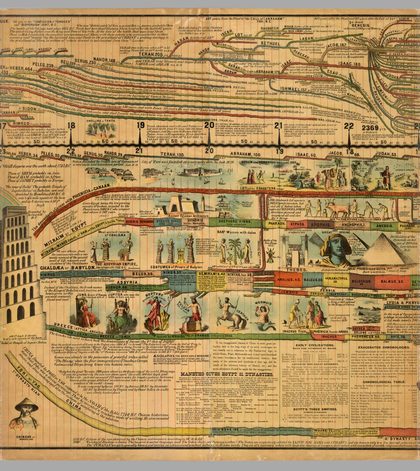 Panel 4
Abraham and the Early Empires
c. 2300–1700 BC
Panel 4
Abraham and the Early Empires
c. 2300–1700 BC
Panel 4 of Sebastian C.
-
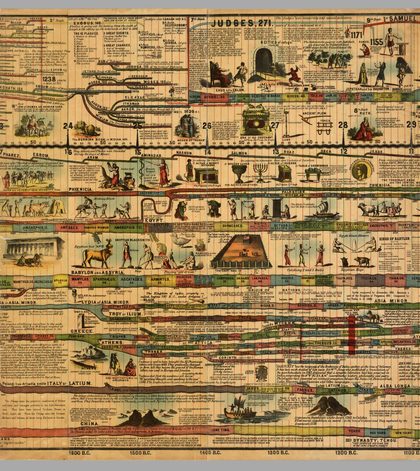 Panel 5
The Exodus and the Age of the Judges
c. 1700–1100 BC
Panel 5
The Exodus and the Age of the Judges
c. 1700–1100 BC
Panel 5 of Sebastian C.
-
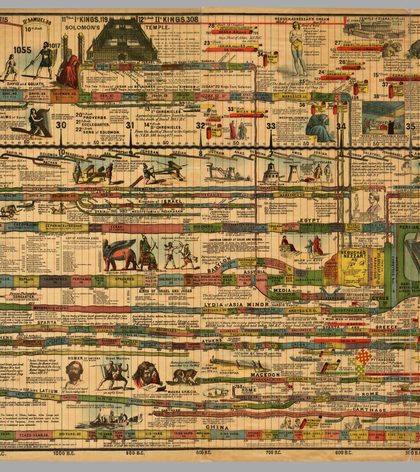 Panel 6
From Saul to Cyrus: Kings, Prophets and Empires
c. 1100–500 BC
Panel 6
From Saul to Cyrus: Kings, Prophets and Empires
c. 1100–500 BC
Panel 6 of Sebastian C.
-
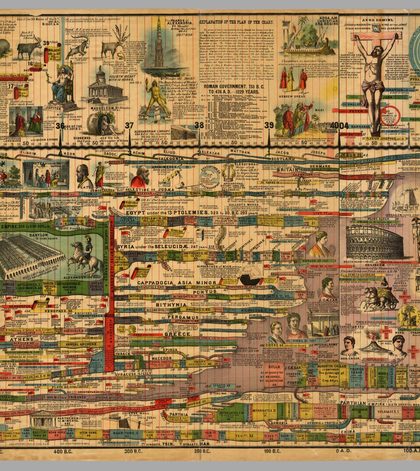 Panel 7
Greece, Rome and the Beginning of the Christian Era
c. 500 BC–AD 100
Panel 7
Greece, Rome and the Beginning of the Christian Era
c. 500 BC–AD 100
Panel 7 of Sebastian C.
-
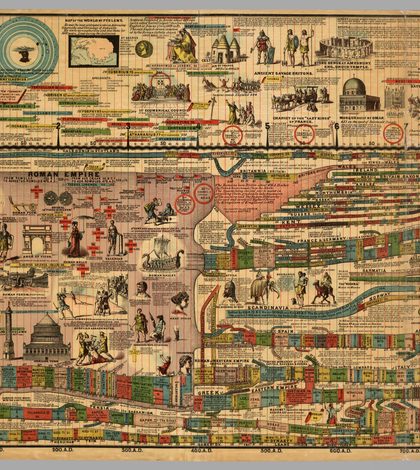 Panel 8
The Fall of Rome and the Hegira
c. AD 100–700
Panel 8
The Fall of Rome and the Hegira
c. AD 100–700
Panel 8 of Sebastian C.
-
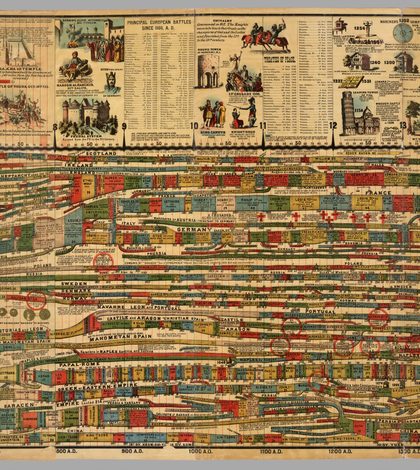 Panel 9
Charlemagne, the Crusades and the Medieval Kingdoms
c. AD 700–1300
Panel 9
Charlemagne, the Crusades and the Medieval Kingdoms
c. AD 700–1300
Panel 9 of Sebastian C.
-
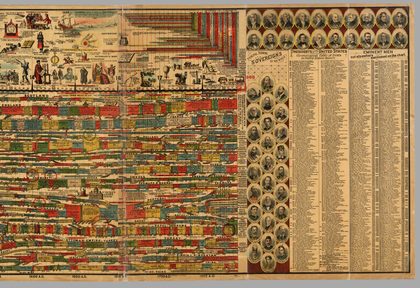 Panel 10
Discovery, Revolution and the United States
c. AD 1300–1878
Panel 10
Discovery, Revolution and the United States
c. AD 1300–1878
Panel 10 of Sebastian C.
Questions about Adams' chart
Who made Adams' Map of History?
Sebastian C. Adams (1825–1898). Born in Ohio, he became a teacher, surveyor and preacher in Oregon, served as a state senator, and settled in Salem, where he conceived the chart. It was printed by the Strobridge Lithographing Company of Cincinnati.
When was the chart published?
Adams registered it in 1871: the chart reads “Entered according to Act of Congress in the year A.D. 1871, by S. C. Adams.” The edition on this site describes itself as “Third Edition and Twelfth Thousand, carefully and critically revised and brought down to 1878,” and it includes additions from as late as 1881, such as a portrait of President James A. Garfield.
What period does the chart cover?
It begins with the Creation, which Adams dates to 4004 BC following the chronology of Archbishop James Ussher, and runs to his own day. Adams’ Key explains that the chart’s century pillars mark off fifty-nine centuries, from 4004 BC to AD 1900.
How do you read the chart?
Time runs from left to right along a long black line that Adams calls the stream of time, divided into centuries by pillars and into decades by red lines. Each nation is a colored stream that begins when the nation first appears in history. As Adams’ Key puts it, events that happened at the same time are found by crossing the chart on a decade or century line, and lines that run together show a conquest.
How long is the chart?
The edition shown on this site is a single continuous chart more than 20 feet long. Sources give different lengths for different editions: Daniel Rosenberg and Anthony Grafton’s Cartographies of Time describes Adams’ chart as about seventeen feet long, while other descriptions give about twenty-three feet. Here the whole chart is shown as one continuous image, divided into ten panels.
Explore the whole chart.
Zoom into every panel and search 13,000+ entries. It's free, with nothing to download.
Text by Heritage Chronology Press. Chart by Sebastian C. Adams, 1881 edition (public domain).